


Negative gearing is still not your friend
10/05/2019 • Leo Patterson Ross

The original version of this post was originally published in 2011. Since then it has been one of the most popular articles of the Brown Couch. been read by thousands of people. Negative gearing has remained a big issue for tenants - we've written more than 50 articles about it! The media has definitely taken up the debate with various mistruths debunked, again, and again, and again.
Real estate agents, arguably the main beneficiaries of retaining a policy which encourages a short selling cycle, have clung hard to their lines. Only time will tell if the next Australian government will accept evidence and remove the lurk.
Given the debate concerning negative gearing still rages we thought we'd take the opportunity to update some of the data. Some of the text has also been updated to match – apologies to the original author, Dr Chris, for any liberties taken.
 One day in August, 45 years ago, a gunman walked into the Kreditbanken branch at Norrmalmstorg Square in Stockholm, Sweden, to hold up the bank. Police were called, the gunman took hostages, and a six-day siege ensued. When the police finally took the bank and the gunman and his associate, there was observed amongst the hostages a feeling of solidarity with their captors. A criminologist dubbed this feeling 'Stockholm syndrome.'
In the Brown Couch's never-ending quest for elaborate extended metaphors by which to describe the Australian housing system, Stockholm syndrome sounds like an appropriate diagnosis for our relationship with negative gearing – that is, Australia's almost unique tax arrangement that allows landlords to deduct interest payments from not just their rental income or capital gains, but from all their income, thus reducing the amount of tax they pay.
Talking with tenants, we occasionally hear them mutter ruefully about how their negatively geared landlords are making out like bandits, but then say, 'oh well, I wouldn't be able to afford to live here if it wasn't for negative gearing.'
Our political leaders feel captured too, repeatedly refusing to countenance any changes to negative gearing and, furthermore, positively supporting it. Politicians of otherwise such divergent points of view as John Howard and Tanya Plibersek (whose public position has subsequently changed) have previously defended negative gearing, claiming that if it were ever changed, rents would go up.
That's the claim: that negative gearing makes renting cheaper than it would be otherwise. We need an intervention. Negative gearing does not make renting cheaper. On the contrary, negative gearing pushes rents up. Tenants, policy makers: negative gearing is not your friend.
First, let's be clear: landlords set the rent at what they can get. If you really think that because of negative gearing, a landlord will accept less, try this experiment: pay your rent $50 short, and tell your landlord that you're helping him reduce his tax. Observe his angry reaction. Note his insistence that you must pay the going rate and if you don't, he'll find another tenant who will. Try another experiment: offer to pay more rent. See if your landlord doesn't take you up on it
The committed negative gearist who finds themselves faced with the prospect of actually making money – that is, their revenues are greater than their costs – is not going to cut their revenues just to keep posting a loss. They are going to refinance, take on more debt, and buy another property. But, we hear you say, negative gearing works to reduce rents by expanding the supply of rental housing
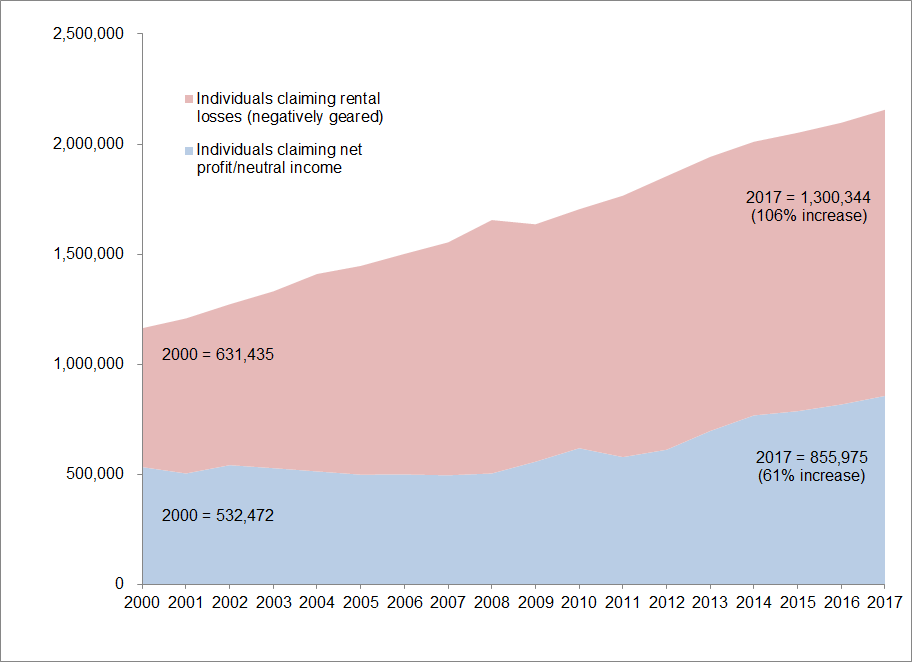
Well, it certainly has expanded the supply of landlords. The popularity of negative gearing saw the number of Australian landlords grow by 85 per cent over the last decade-and-a-half, and the proportion of them posting a net loss grew from just over half to over 60% (it got as high as 70% just before the GFC).
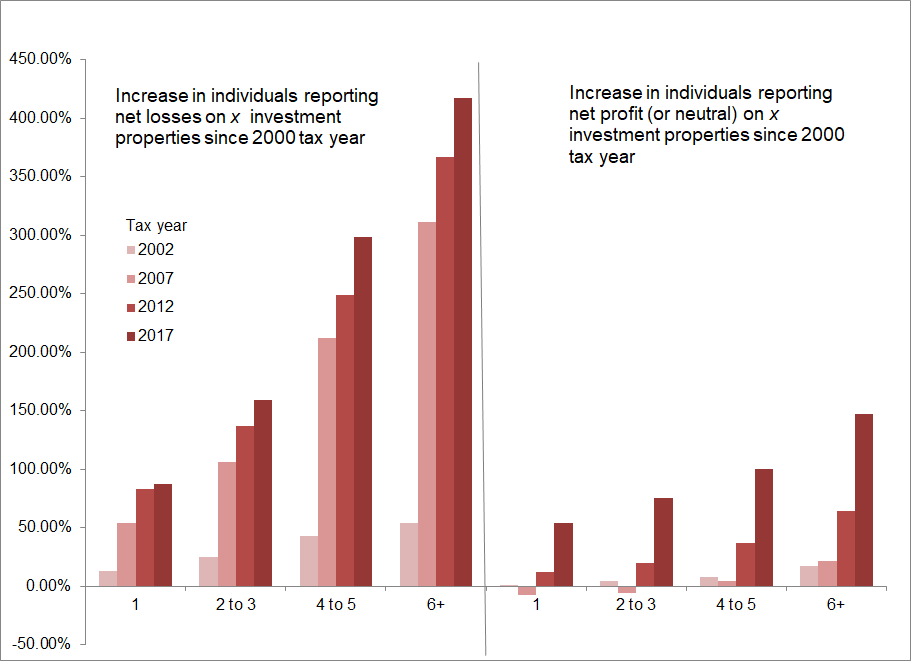
And because, much like a giant game of Monopoly the point is to crowd out everyone else – they're using negative gearing to accumulate ever more properties. Here's the increase in people holding different numbers of dwellings. There has been a 400% increase in the number of people holding 6 or more properties who are negatively geared - increasing 4 times faster than those holding one. While being wealthy already is the best way to build wealth, negative gearing pours fuel on that fire - people holding 6 or more properties and being positively geared has increased a third as fast as those who are negatively geared.
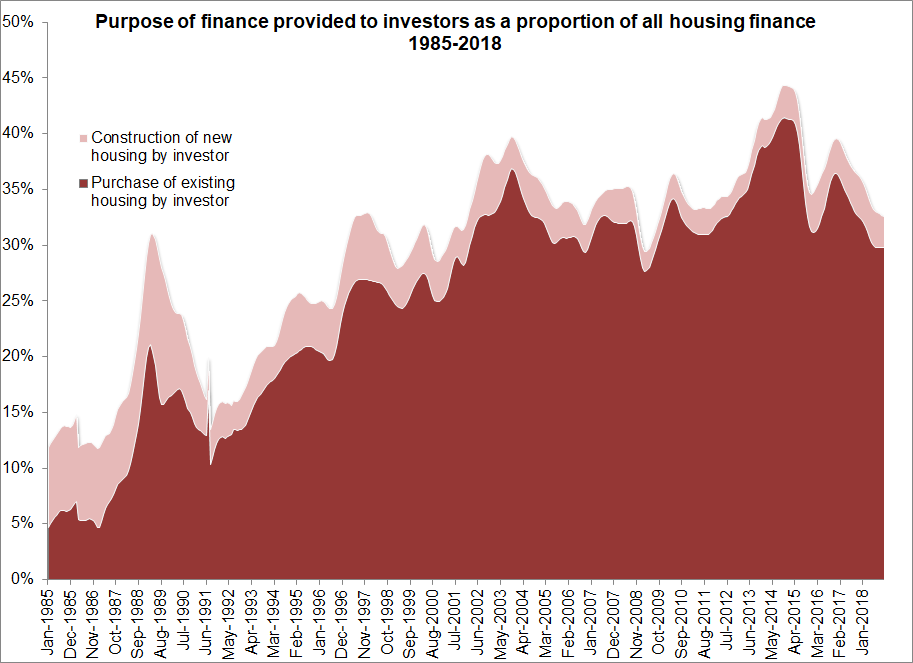
But look what they've spent their (borrowed) money on collecting: established dwellings, not new construction. Not only has this been the driving force of investor dollars - it has also come at the expense of owner-occupied finance.
So they've expanded the supply of rental housing, but only by turning dwellings that might otherwise be owner-occupied into rental. In other words, along with any expansion in the supply of rental housing goes an expansion in the supply of renters
This is reflected in the declining rates of home-ownership amongst younger households (25-44 year-olds) – and, for that matter, middle-aged households (44-65 year-olds).
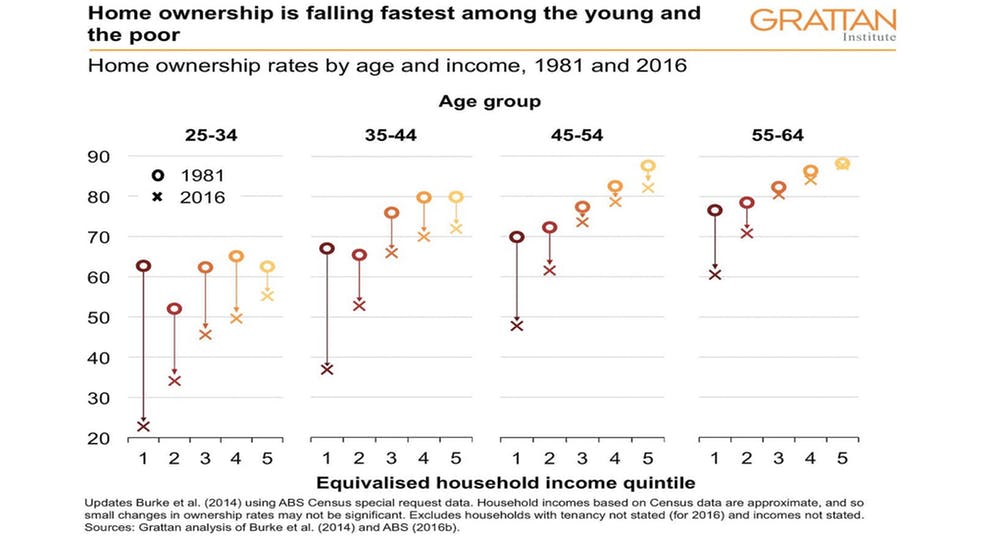
These households are in the prime income-earning years of their lives, and many would be owner-occupiers if they weren't priced out by big-spending negatively geared landlords. Instead they are renting – alongside the low income households who have always rented. AHURI researcher Kath Hulse and her colleagues have charted over the period 1996-2011 the rise in the number of renters who are in the higher segments of the income scale:
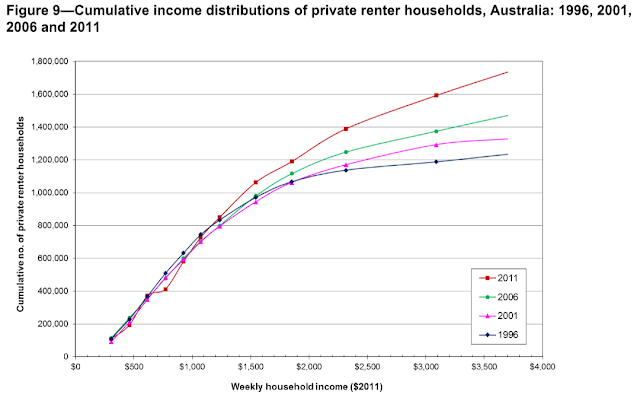
The chart shows very clearly that the relative growth in private renters has come at higher income groups. Starting at gross household income of around $1500 per week (in $2011), and really kicking in at about $1800pw higher income households are increasingly renting households.
Now, these higher-income renters can afford to pay more than their lower-income competitors, so their presence in the market helps push up rents. They also out-compete the lower-income households in terms of risk and general attractiveness to landlords, so if they want to save a bit of money and live in a relatively cheap rental dwelling, they very often can – which means a lower-income household, who really needs the lower rent dwelling, will have to look at renting another, more expensive dwelling.
We had been able put some number on this problem, thanks to the now defunct National Housing Supply Council. In the latest figures from 2009-10 (the latest figures), Australia had 857 000 low-income households (that is, in the bottom 40 per cent by income) who are renting in the private market... and the private rental market has 1 256 000 dwellings that would be affordable for these households. That's apparently more than enough affordable rental dwellings... except that 937 000 of those relatively cheap dwellings are occupied by households above the 40 per cent line. That left 537 000 low-income households paying a higher rent. This was up from 493 000 two years earlier.
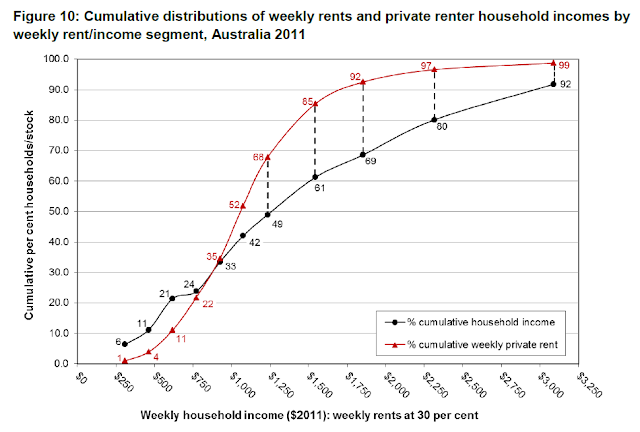
This mismatch is well-demonstrated in this next chart showing the relative distribution of housing affordable at 30% of gross household income. We should be hoping for the red line to stay above the black line, remembering that (in an extreme example) a household earning $10,000 per week paying 80% of income on rent still has twice as much money after paying for housing than a household earning $1000 a week does before paying for housing. Affordability is a relative term.
The first points on the chart show that there are 6 times as many households as houses affordable (though not necessarily available) at the lowest quintile ranges of the population. Meanwhile the highest 65% of incomes have relatively plenty of properties very affordable to them:
It's hasn't gotten better since these figures. We didn't have anyone looking at it this figure in exactly the same way for some time. The Hulse et al report above used a different data source, and different methodology, resulting in different numbers - still heartbreakingly high at 395,000. However AHURI and City Futures last year completed comprehensive projects which give us the shortfall of housing for low-income people by adding together all the people experiencing homelessness or living in rental stress. Again there are differences, but as close as we can get the current shortfall of affordable housing had now climbed from 537,000 in 2010 to 651,200 in 2016.
And it is not just a problem of how the relatively low-rent properties are shared around, because the number of low-rent properties is declining, too – thanks to negative gearing. As a strategy, negative gearing depends on the prospect of capital gains: the negatively geared landlord makes a profit only if the (lightly taxed) capital gain at the end of their speculative adventure is more than the total income lost to interest etc along the way. So negatively geared landlords will go for properties where there's strong expectations of capital gain... and pass on properties that are not so blessed. The latter properties, as economists Woods, Ong and Stewart point out (in a paper for the Henry Review), are the relatively low-value, low-rent properties that low-income renters seek out. Over time, as properties are bought and sold, these sorts of properties drop out of the rental sector, and as they become scarcer, they become less cheap.
We can put numbers on this too, again courtesy of one of the Hulse et al's study. Between 2001 and 2011, Australia's private rental stock grew by 407 000 dwellings. All of this growth was in dwellings that rent for more than $279 per week – and mostly more than $370 per week. Over that period, we lost 331 000 dwellings in the $278 or less price range (and all those dollar amounts are 2011 dollars, so we're comparing apples with apples). The Council provides a graph to illustrate the changing shape of the rental market, under the influence of negative gearing. Notice the bulge in properties around $200 flatten down and push up further along the scale of rents at $300 per week and then rapid rise of a new bulge at around $450 per week. We understand the 2016 figures have been crunched but are awaiting publication - we'll update these charts again then.
To recap:
- negative gearing does not cause an individual landlord to charge less rent;
- negative gearing does not create net additional rental housing;
- negative gearing has contributed to more higher-income households renting, which both pushes rents up, and pushes lower-income households out of lower rent properties;
- negative gearing has contributed to low-value properties dropping out of the rental market, which pushes up the rent for those that remain in rental; so therefore
- negative gearing is not your friend.