


Access to justice? What the NCAT snapshot tells us
25/10/2023 • Rathy Srikanthan

Jack Moon
The Tenants' Union NCAT Snapshot and NCAT Evictions Map are interactive resources that share key insights into how landlords and renters have used the NSW Civil and Administrative Tribunal across all Local Government Areas (LGAs) in NSW since 2016.
NCAT is the main forum for resolving tenancy disputes between landlords and tenants in New South Wales. While this can mean that the NCAT is a way for renters in New South Wales to assert their rights, landlords are disproportionately the applicants for disputes lodged at NCAT. Applying to the NCAT takes time and resources that renters' often struggle to access. Many renters prefer to, instead, terminate their tenancy than pursue legal recourse. The data with the NCAT Snapshot and NCAT Evictions Map allows us to examine key dimensions of this power imbalance, by breaking down NCAT applications by user type, application type and geography.
When interpreting this data, it is important to note that the evictions in this dataset are only the evictions that have been lodged with NCAT. They make up only a very small subset of total evictions. NCAT evictions make up only 1% of all tenancies ending, and comprise approximately 3.9% of all evictions (landlord initiated end to tenancies) in NSW.1
Who is using the Tribunal (the NSW Civil and Administrative Tribunal or NCAT)?
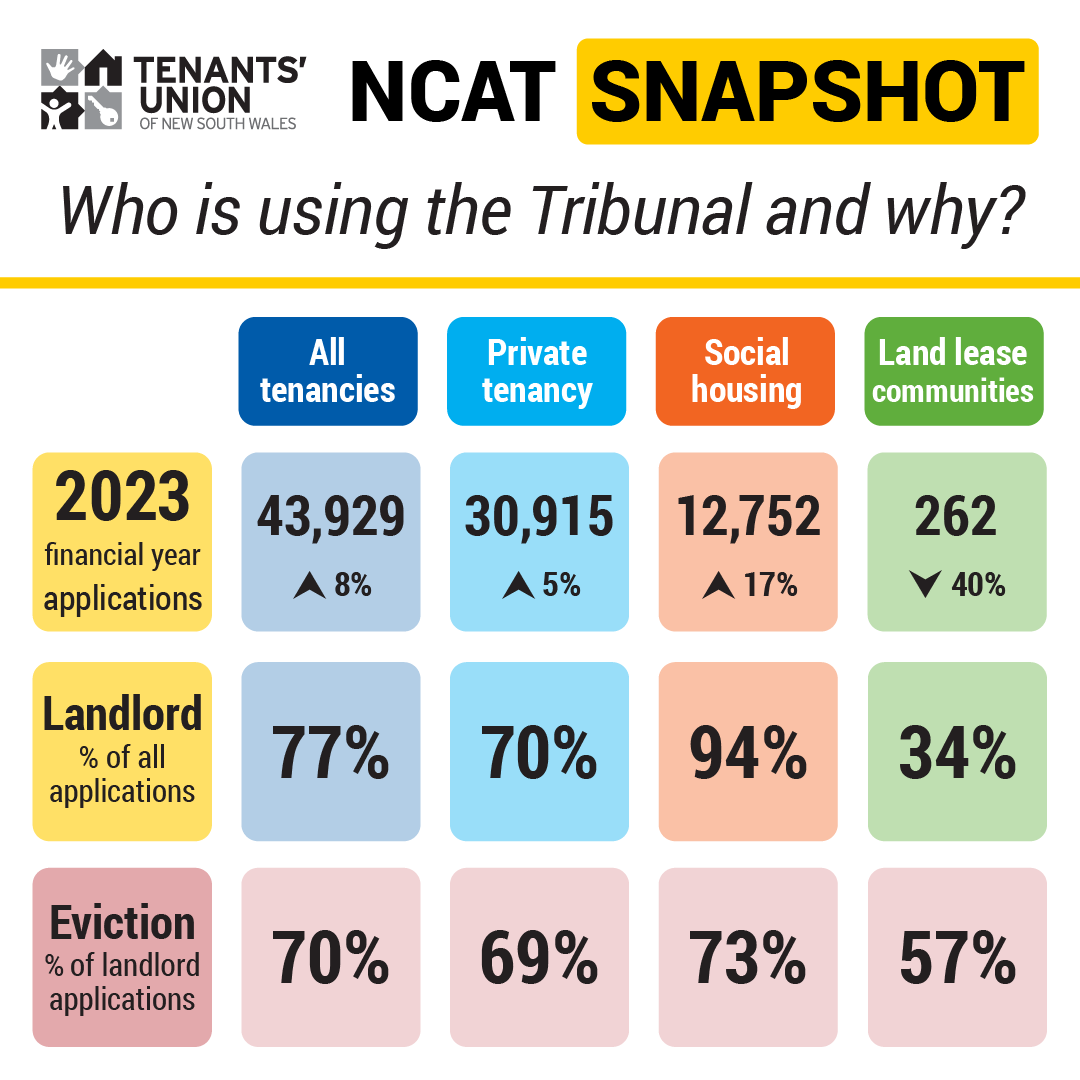
Landlords are the majority users of the NCAT by a wide margin. Over three quarters - 77% - of NCAT applications come from landlords; 70% of applications for the private rental tenancies and 94% of applications for social housing tenancies.
What for?
From the data, it is clear that NCAT applications impact some demographic groups more than others. Tenants in socioeconomically disadvantaged areas (see ABS' Socio-Economic Indexes for Areas) across metropolitan Sydney are the most likely to be respondents to an NCAT dispute.
Key findings:
- Across all tenancy types, the vast majority of NCAT applications submitted by landlords were for ‘Evictions’ (70%), whereas for renters the majority of applications submitted to NCAT were for ‘Rent and Bond’ (52%).
- Across all tenancy types, for both renters and landlords, ‘General orders (compensation, breach, etc.)’ were the second most common application type submitted (21%, respectively).
- In Social Housing, ‘Evictions’ represented a similar proportion of landlords’ applications to all tenancy types (73%); however, ‘General orders (compensation, breach, etc.)’ (37%) and ‘Repair’ (33%) applications were more common than ‘Rent and Bond’ applications (17%) for renters. Note: most renters in social housing do not provide a bond.
- Applications for eviction were highest across Greater Western Sydney, followed by the Central Coast.
- Repair applications were highest across Greater Western Sydney and Inner Sydney.
- Applications for eviction (termination) rates were typically around 4x higher for renters in social housing than for renters in private tenancies.
Access to justice?
From the data, key focus questions emerge around equity and justice for renters. What are the limiting factors to renters accessing NCAT as a legal recourse? What support systems do renters experiencing socioeconomic disadvantage need in place, to sustain longer and healthier tenancies? Where interventions are designed to address these questions, continued analysis of NCAT data may assist in evaluating their efficacy.
Want more?
Check out –
- The ‘NCAT Snapshot’ for a more detailed breakdown of NCAT applications by tenancy type: [tenants.org.au/reports/ncat-snapshot : Do we have a URL shortener?]
- The ‘NCAT Evictions’ Map to explore eviction rates and total repair applications across all NSW LGAs: tenants.org.au/reports/ncat-evictions-map
Get in touch
Is there anything you want to see from the data that’s missing? Shoot us an email at contact@tenantsunion.org.au
Notes
1. In estimating the percentage of evictions that are ordered via NCAT we have drawn of the following data:
- From end of tenancy survey (estimated total value using survey is 17% sample size):
- 450 tribunal ordered evictions (or an estimated 2,647 tribunal ordered evictions)
- 10,989 Landlord initiated evictions (estimated 64,641 per year)
- From this data Tribunal ordered evictions make up 3.9% = 450/(450 + 10,989) of evictions.